Interactive Infographics
Digital engagement is at a premium. Generic text and stock imagery are out, and interactive content is in. Eye-catching visuals and dynamic experiences captivate audiences like never before, making interactive infographics a powerful tool for visual storytelling and conveying complex information. At Brafton, we help you create interactive infographics that elevate your content creation strategy and engage your audience.
By entering your email address, you agree to receive emails from Brafton in accordance with our Privacy Policy.
You may unsubscribe from these communications at any time.

How It Works
We use a multi-tiered infographic design model that customises the scope and size of your graphical assets to match your commercial needs. If your brand has big dreams, we’ve got big content ready to make an impact. Our approach ensures every project — whether it’s a quick read or an in-depth exploration — delivers maximum value.
Interactive infographics are the next frontier in content marketing. They enable your site visitors to interact with your brand directly allowing your readers to actively participate. Incorporating advanced data visualization techniques, we create interactive experiences that foster learning and engagement. Our infographics, interactive by design, transform static information into dynamic narratives.
Interactive Infographic Examples
Click on each interactive infographic example to see it in action:


What is an Interactive Infographic?
Interactive infographics are data-rich, visually compelling and engaging. They utilise animation so users can “interact” with the design. In essence, viewers can discover information by scrolling, clicking, unfolding, panning and zooming over the infographic. These movements trigger the functions within the design to display additional content.
Common examples include:
Interactive infographics are superior to static infographics. They allow for more interesting data visualization, dynamism in the types of information that can be presented to your viewer. Creating interactive infographics provides your audience a more engaging way to explore your detailed information and more complex data. This eye-catching medium enhances learning and retention.
Interactive elements can easily turn a good infographic into a great infographic. They provide an eye-catching medium for digital storytelling, enhancing learning and retention of detailed information. Readers can explore at their own pace, making the experience both informative and enjoyable — a perfect read that leaves a lasting impression.
How Interactive Infographics Are Created
Interactivity requires integration and proficiency with certain technologies, such as Adobe Illustrator, Photoshop and Adobe After Effects. The web page hosting the infographic should include embed code, typically from a custom-built tool or a third-party resource, which enables animated elements on the site. Our team ensures all components including cached assets function seamlessly to provide an optimal user experience.
The infographic creation process begins with a concept that requires involvement from Design, Animation and Tech departments. We provide standard infographic sizing options, but the best (or largest) ideas are better suited for interactivity. An interactive infographic will require more data, research, user options (multiple choice questions or multi-layered pop-up functions, for instance) and programming to create. Our team ensures that every custom widget enhances the user experience and aligns with your brand’s goals.
After creating written outlines and mockups, we send them to you for approval. We then begin creating the infographic from scratch while testing different visualisation and engagement tactics that could enhance the user experience. This includes integrating cached assets and components to optimise performance and interactivity. Our designers focus on visual storytelling to make your content informative and captivating. We pay attention to layout details, such as grid columns and footers, ensuring a cohesive and aesthetically pleasing design. The final product is determined by you and your strategist.
We begin measuring web results to report on progress, utilise data visualization tools to monitor engagement and learning outcomes. This ensures your interactive infographic achieves its intended impact. Our analytics cover various metrics, from time spent on the page to interaction rates.
Including Interactivity in Your Marketing
Interactive infographics can serve as standalone assets on a web page or as part of a more holistic content launch. Many of our clients create infographics for use as sales-enablement tools or to demo products or software in a user-friendly way. By integrating elements like custom widget footers, we ensure that your interactive content complements your site’s overall design.
At the top of the funnel, you can promote interactive graphics on social media and insert yourself into industry conversations by designing around recent trends. Brafton designers can also animate a custom image, creating shorter motion infographics that can stand in for a stock image in a blog post. This approach grabs attention and encourages readers to engage with your content longer.
Further down the funnel, this visual content allows you to collect prospect data based on how they interact with your graphic. If the design is a question-and-answer format, you can track the specific route their responses took — one direction could signal the user is simply a site visitor with little interest in your product, while another direction could mean a visitor is a warm lead.
You can qualify prospects more quickly and produce follow-up content based on their interaction with your graphic. By understanding how users read and engage with your infographics, you can tailor your marketing strategies more effectively.
Interactive infographics are more resource-intensive to create but also higher quality. To maximise the asset’s value, you should promote them to your target audience by distributing them across multiple channels. Incorporating eye-catching designs and interactive elements makes your content stand out in a crowded marketplace.
Action in your graphics leads
to interaction on your site.
The Visual Marketing You Need
We believe in content that converts, content that makes an impact. Without visual elements, your content marketing dollars are wasted. Our focus on visual storytelling ensures your message resonates with your audience. Whether a detailed analysis or a quick read, our infographics capture attention.
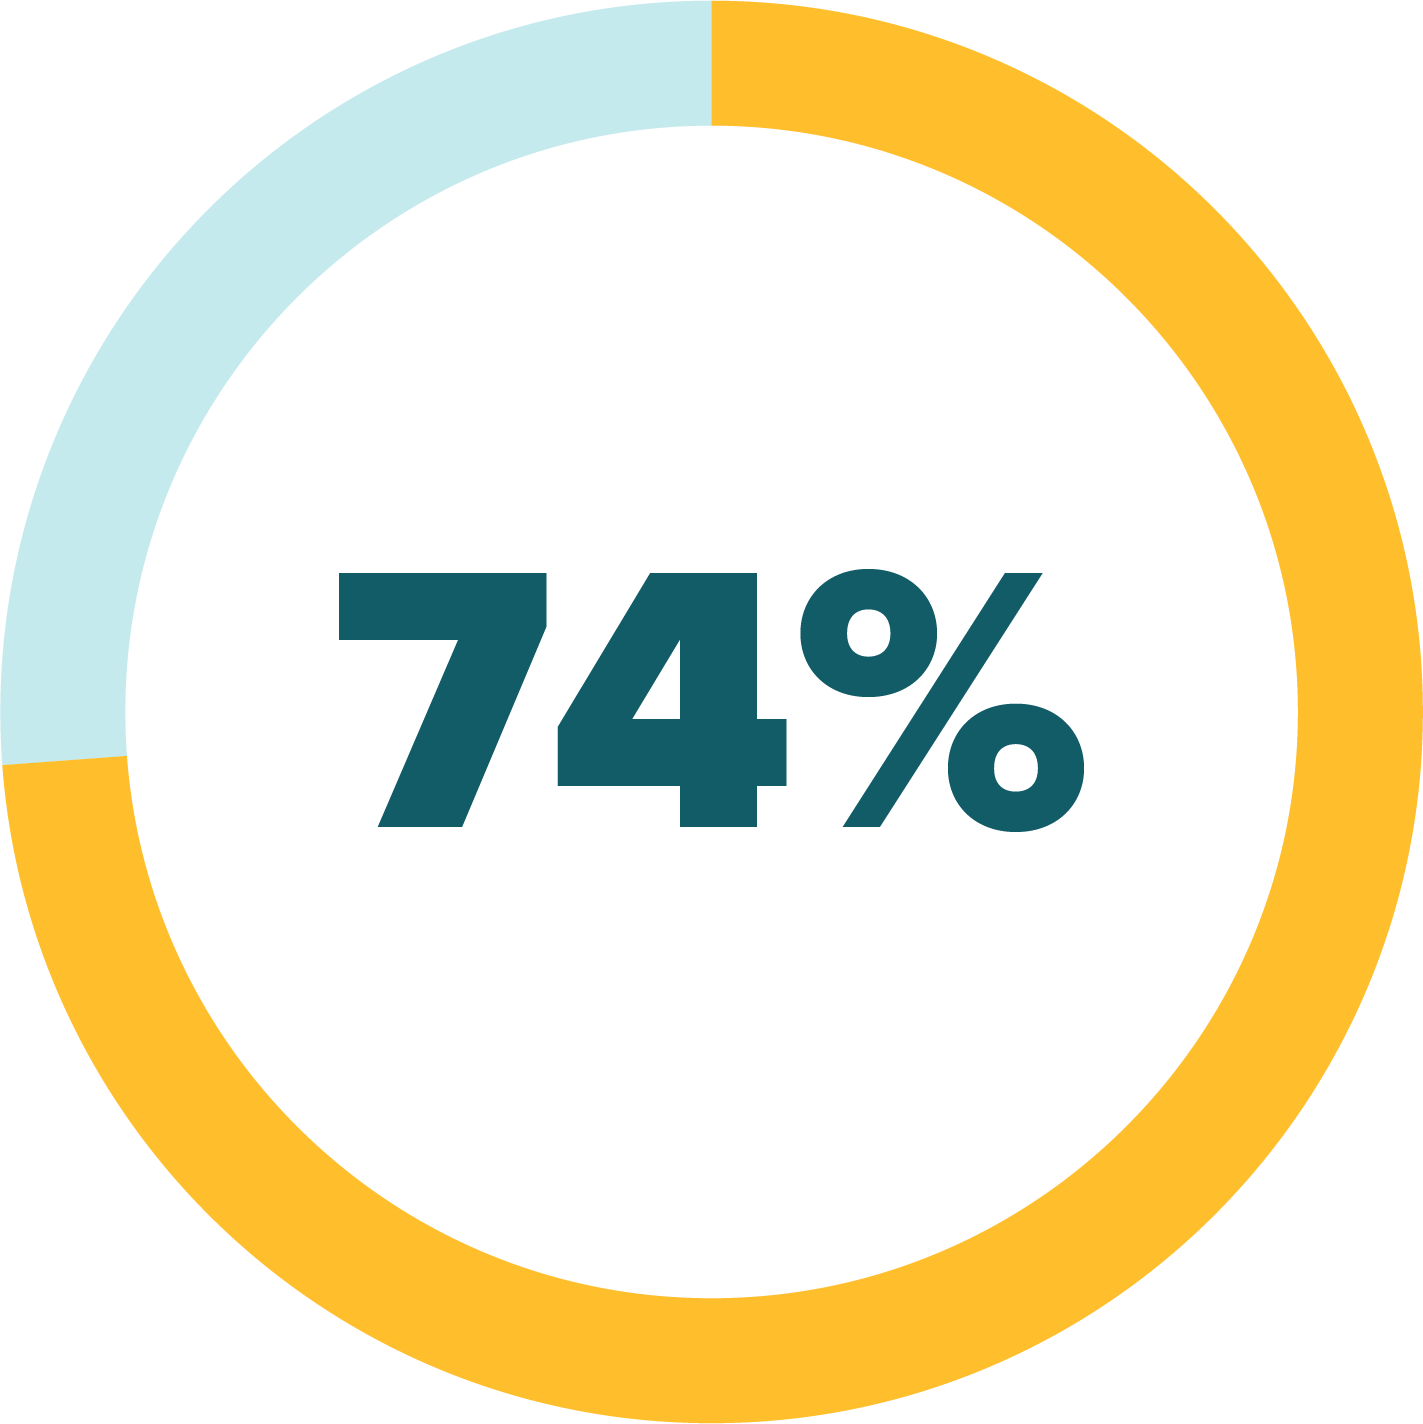
74% of marketers use visuals as the primary asset in their social strategies.
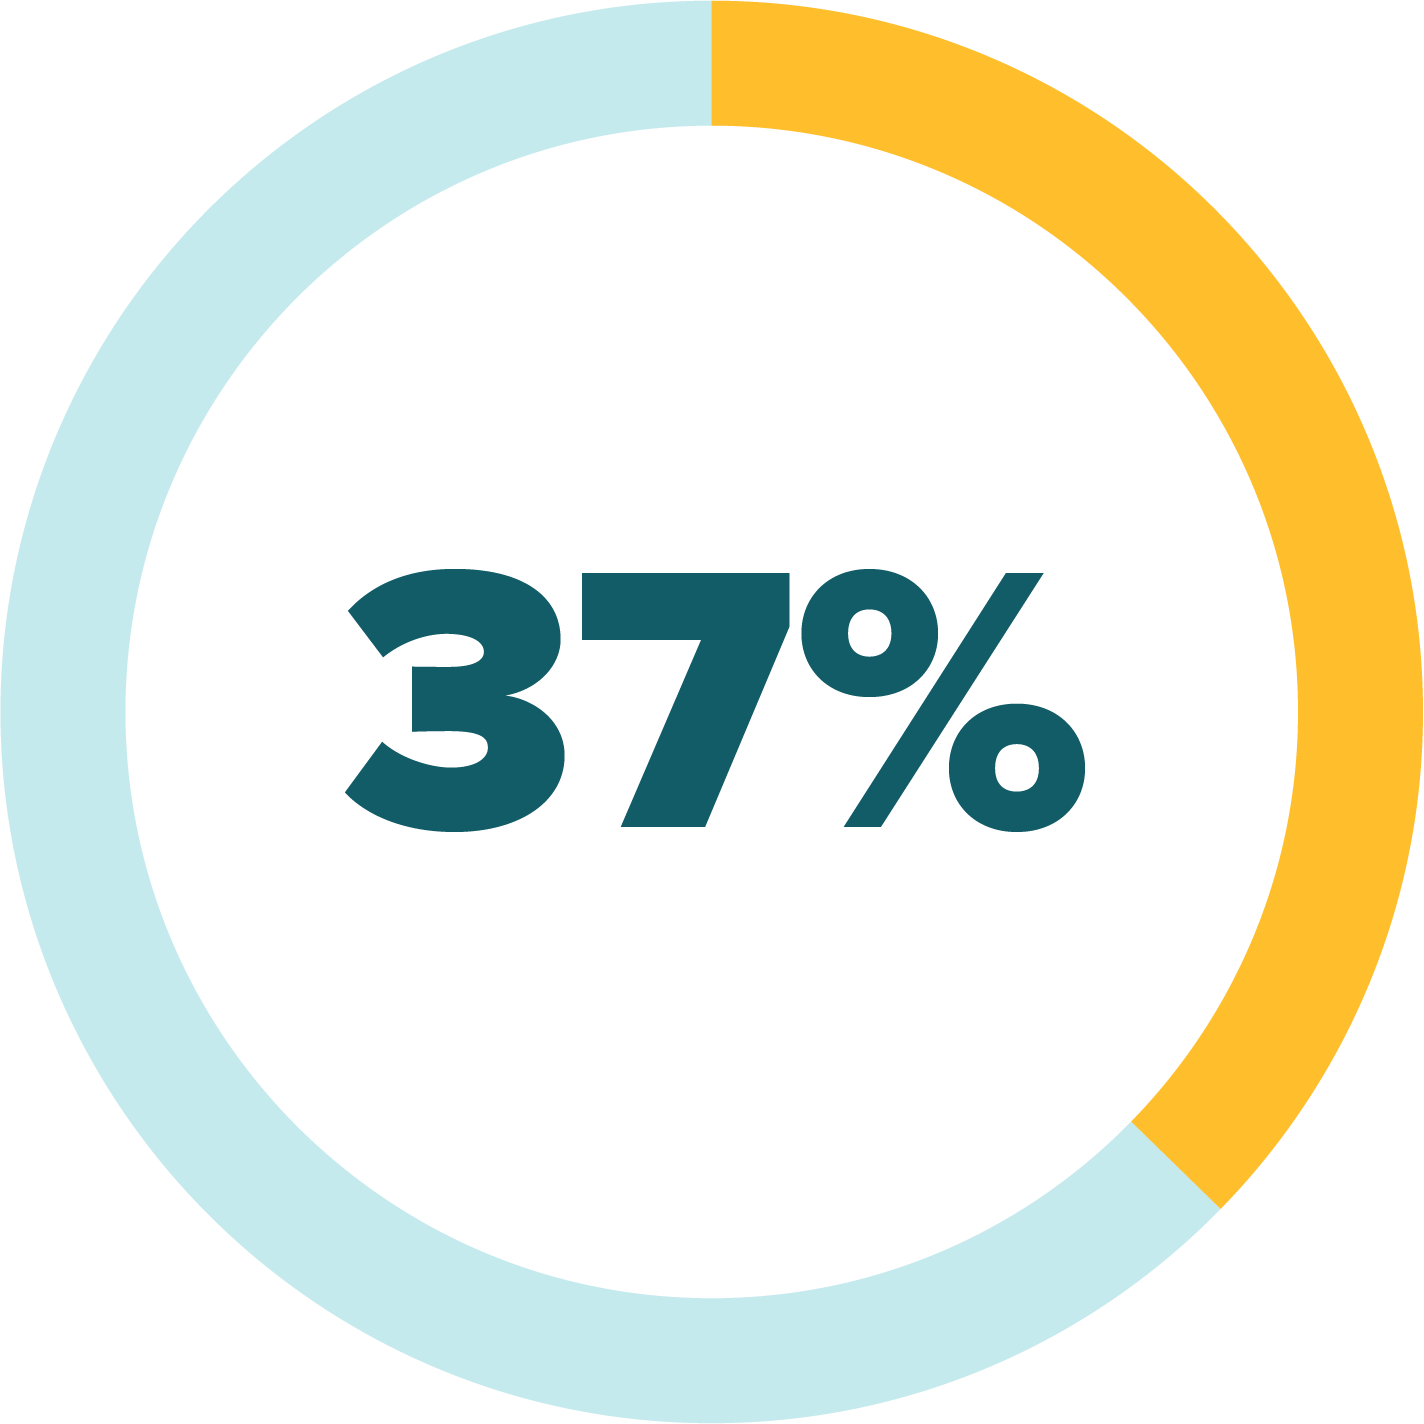
37% of marketers state visuals are the most important type of content for their businesses.
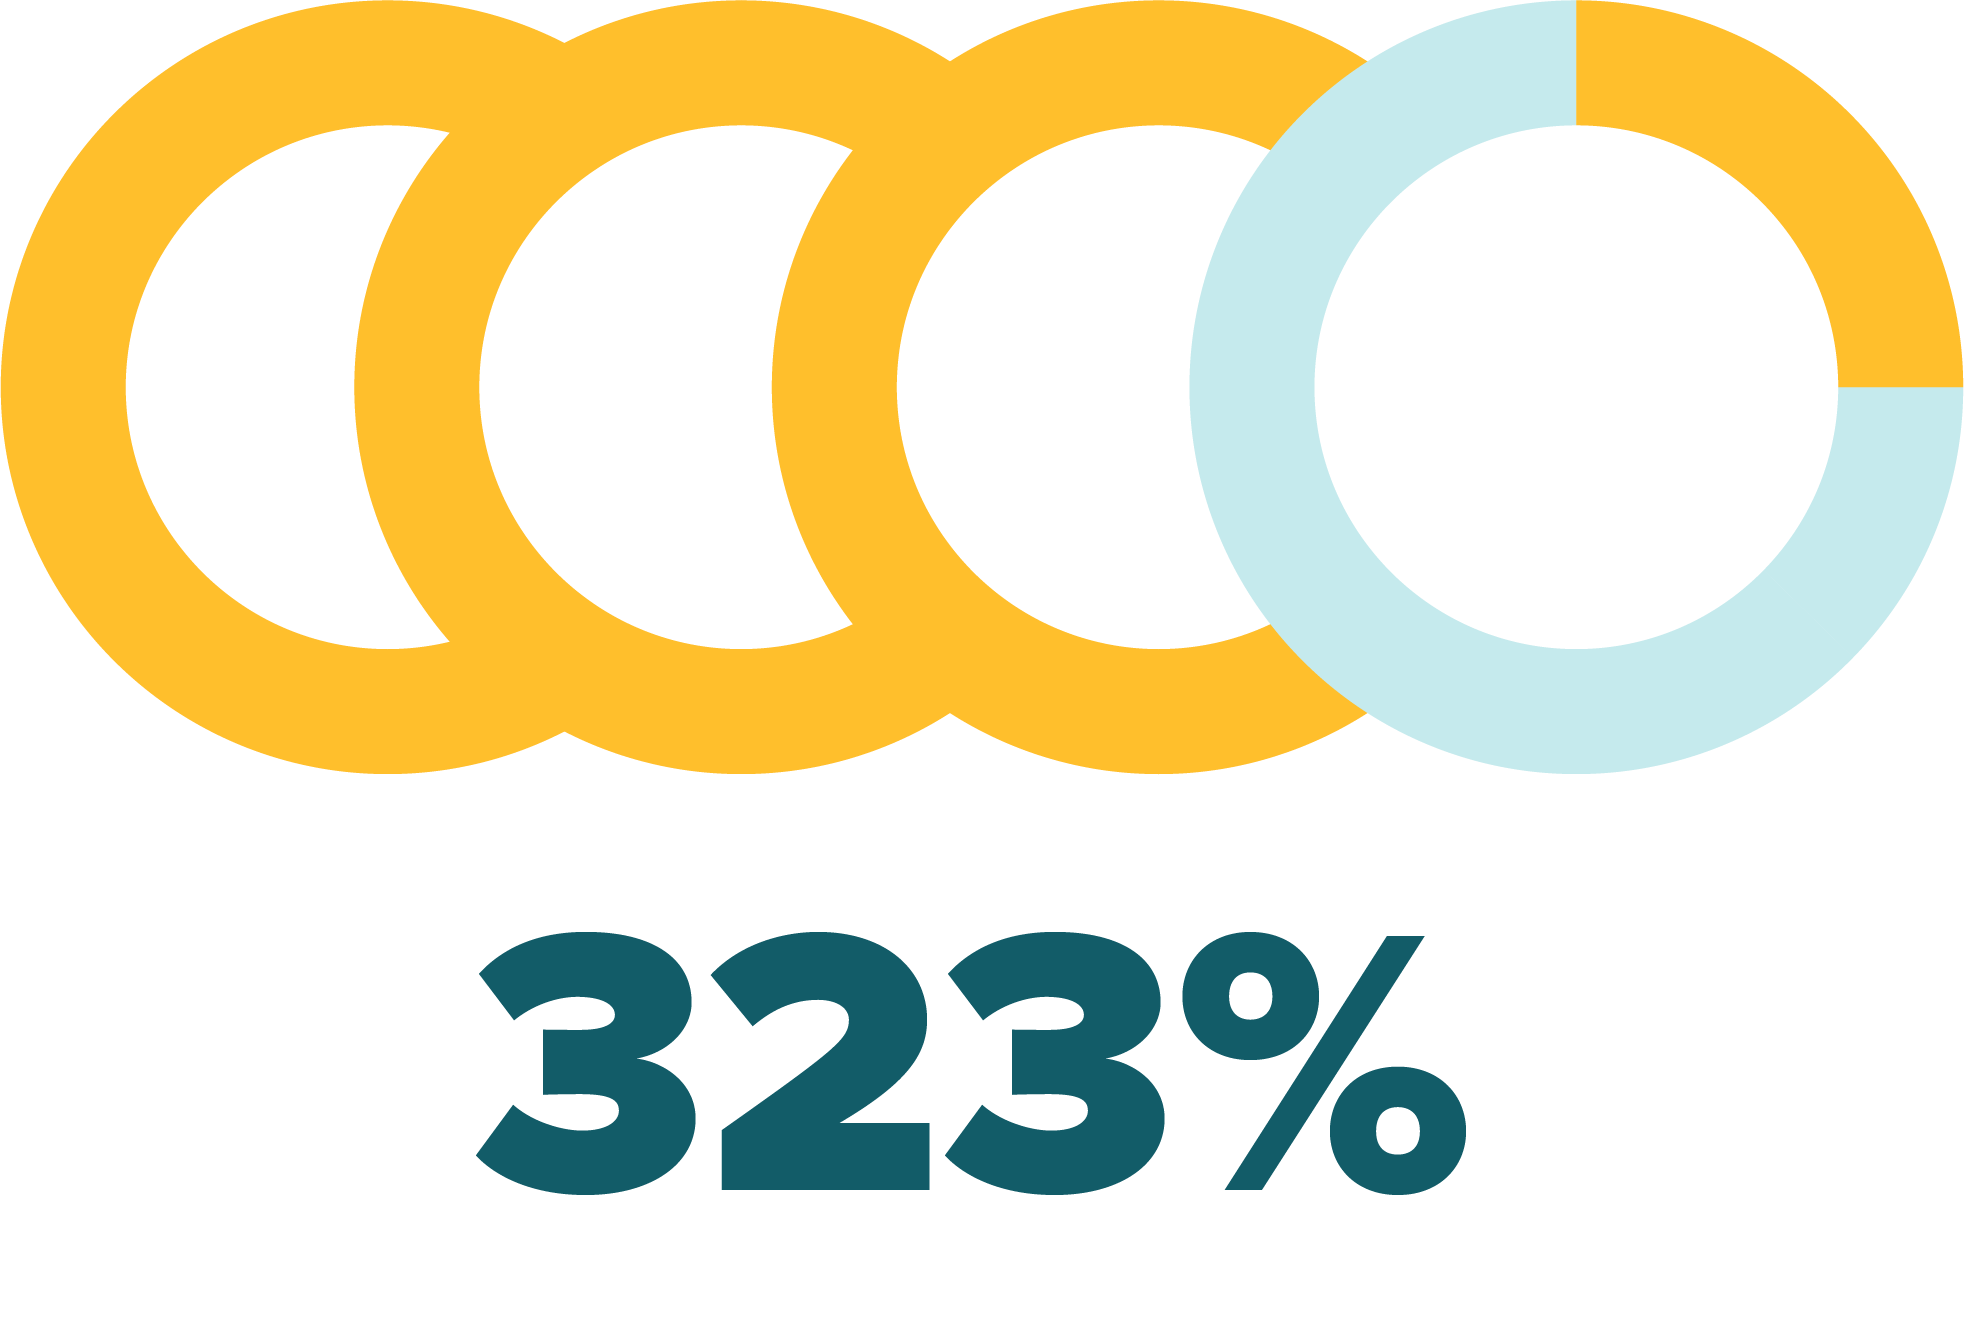
People follow directions 323% better when using text + illustrations compared to text alone.
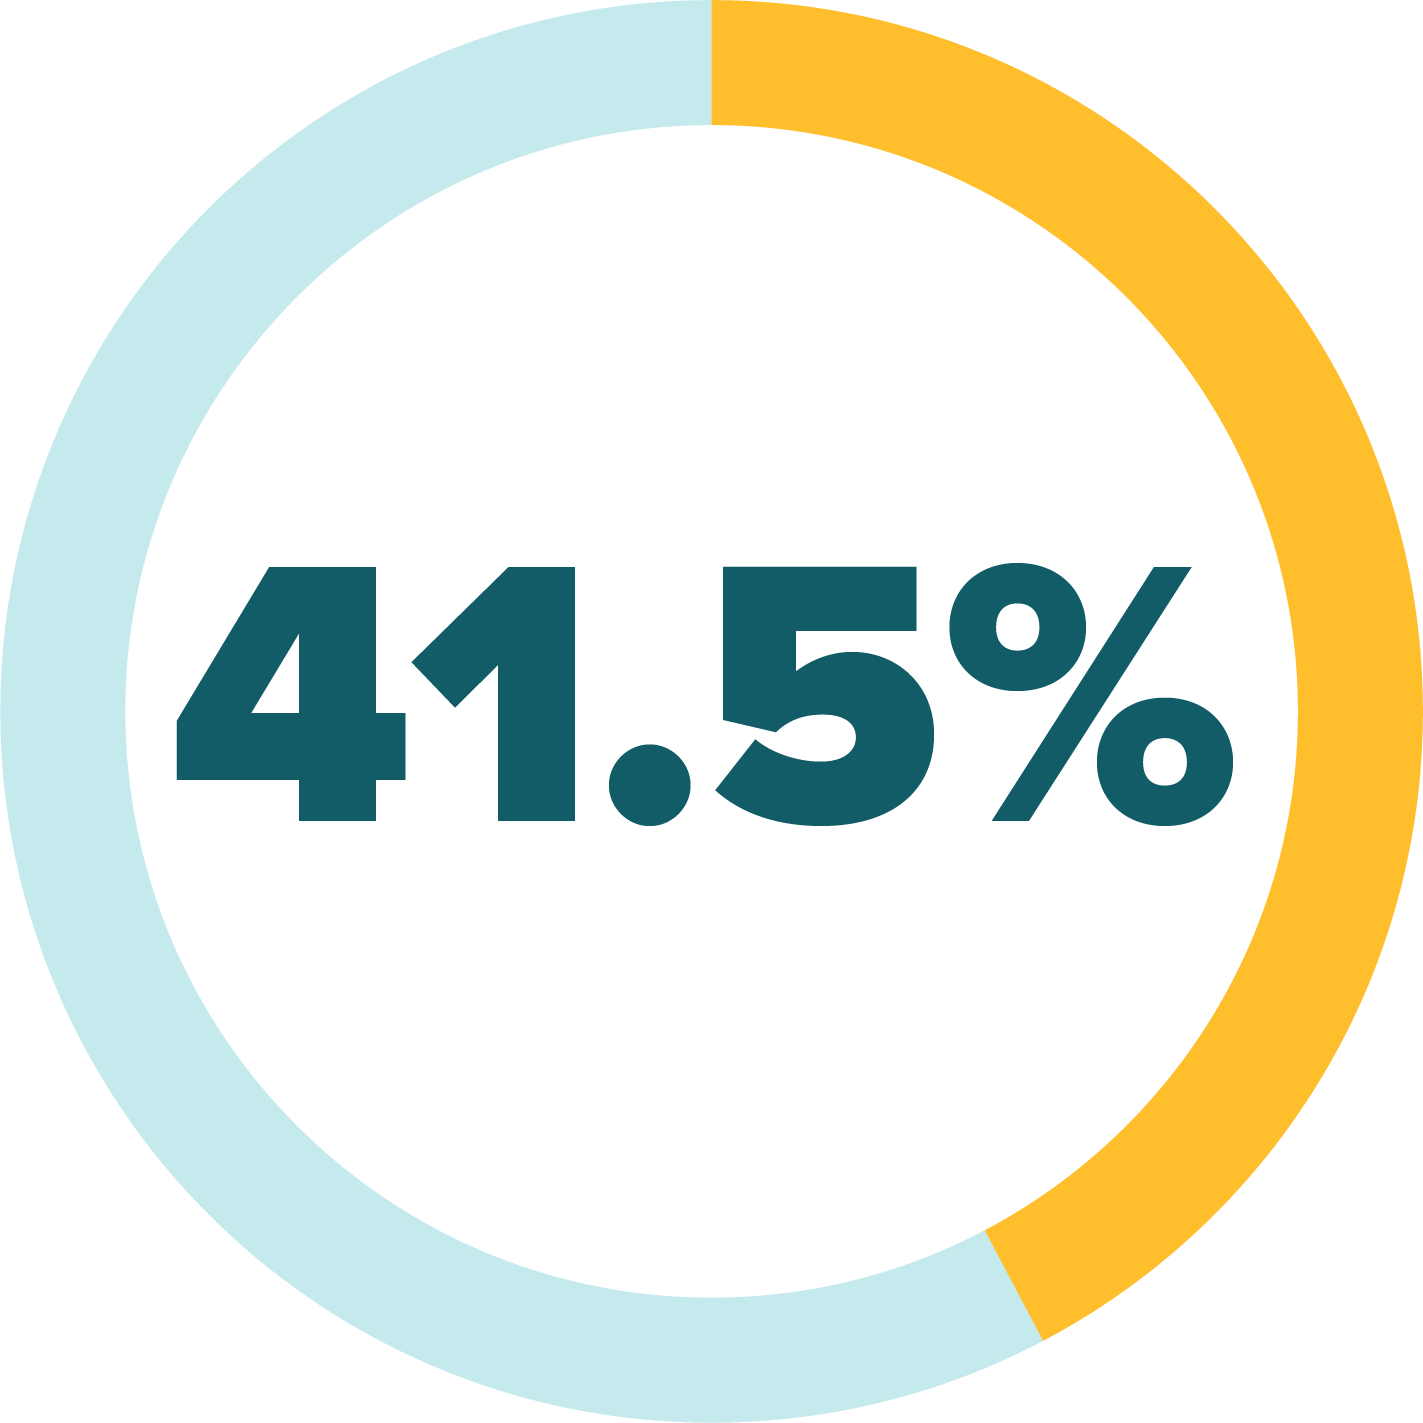
41.5% of marketers state custom infographics drive the highest visual engagement for their brand.

31% of marketers state they devote more than 40% of their marketing budget to visuals.
More than 4 billion people have internet access, and your content must compete with all of the information on the web to earn an audience. Incorporating interactive elements and data visualization is key to making your content memorable and engaging.
Not in Australia?
In the UK?
In the US?
In Germany?
